Debug for AuboCaps Guide
Duringaubo_capsdevelopment, debugging the plugin under development in theaubo_scopetutorial is a very important and frequent task. This tutorial is based onqtcreator and gdbcommand line debugging solution, developers can choose the debugging solution that suits their own usage habits.
Oscillator plug-in development and debugging program based on qtcreator
Plug-in output path settings:
For aubo_capsto run, it must be loaded into the working directory of aubo_scope. After installing the arcspackage, a folder arcs_wsis generated in the root (or home)directory, and that file is the working section of aubo_scope, build a runnable plugin, set the output path of the target attribute to be under arcs_ws when building a runnable plugin.
The specific realization is as follows: (in the plug-in project CMakeLists.txt set, to the example plug-in project myplugin as an example)
#Setting the output path of the plug-in
set(PLUGIN_OUTPUT_PATH $ENV{HOME}/arcs_ws/extension)

#Building plugins that can be loaded in aubo_scope
add_libary(myplugin SHARED
	${_srcs}
	${install_src}
	${program_src}
	)
set_target_properties(myplugin PROPERTIES
	LABELS aubo_caps
	OUTPUT_NAME myplugin
	PREFIX ""
	DEBUG_POSTFIX ""
	LIBRARY_OUTPUT_DIRECTORY ${PLUGIN_OUTPUT_PATH}/myplugin
	CXX_VISIBILITY_PRESET hidden
)
In this example, when generating the
myplugindynamic library file, the${_srcs},${install_src},${program_src}files used can be set according to your own plug-in needs.When setting the generated
mypluginattributes, in this tutorial, pay attention to theLIBRARY_OUTPUT_DIRECTORYtarget path settings, and other attributes can be set according to the needs of your own plugin.
Compilation configuration for plugin projects in qtcreator:
Main idea: change the runtime configuration of the plugin project, so that when compiling the plugin project, directly update the content of the plugin under
arcs_wsand runaubo_scopefor debugging.Specific configuration: (Taking
mypluginas an example here)Open
qtcreatorand open our plugin project.SelectProhectsin the left menu bar and click
run. The following options need to be configured in this screen:Active Project: Select the plug-in project.Running Configuration: To add a new running configuration, click
addon the right.EXecutable:Set this path to the location of theaubo_scopeexecutable. Installarcsunder/opt/arcsby default.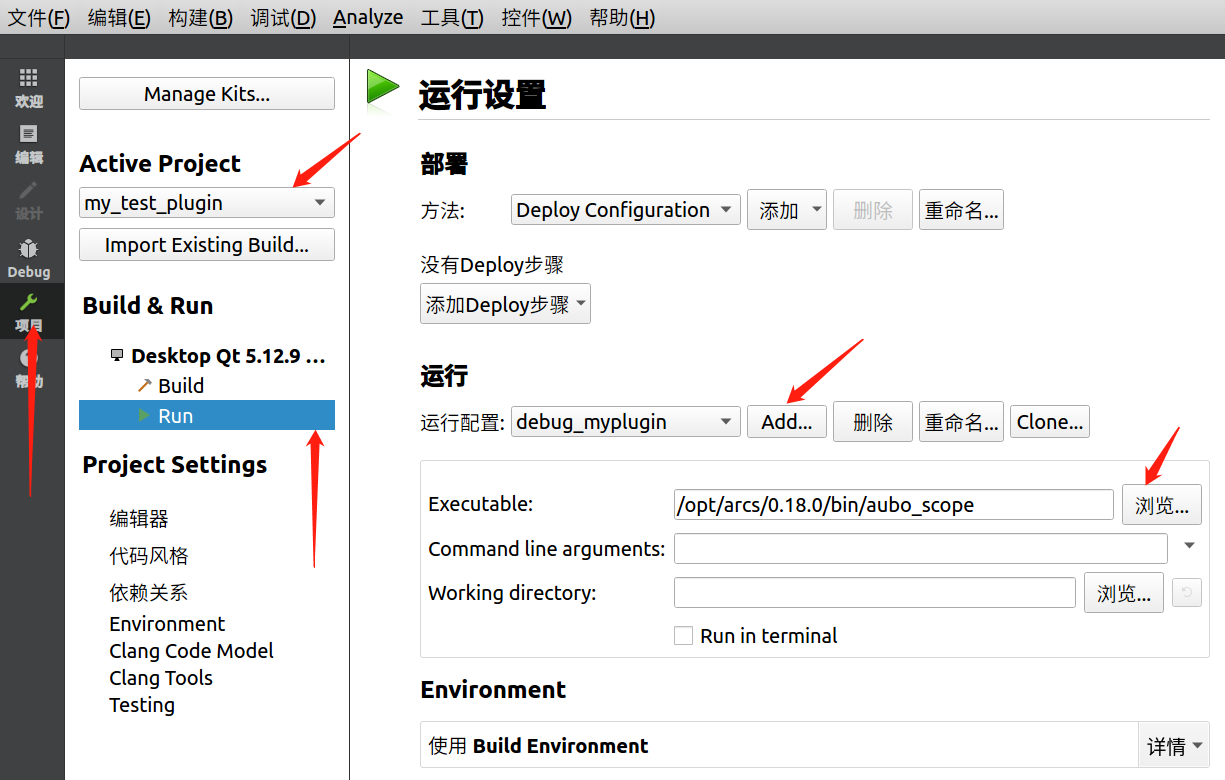
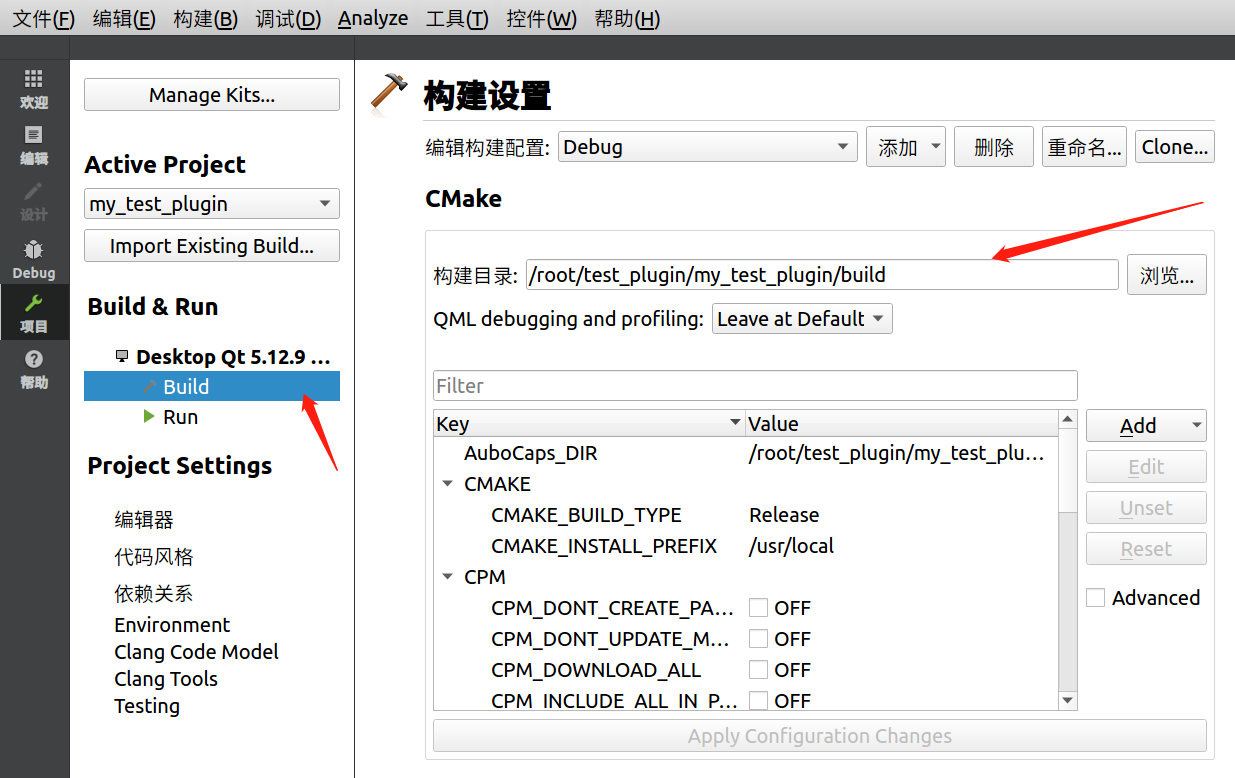
It is recommended that the path to
Buildis also customized: (usually set to thebuilddirectory)- SelectProject->Build->Set Build Directory
The general process of debugging a plugin in qtcreator:
After completing the above configuration, select the newly configured option and directly compile the plugin project to debug the plugin.
If multiple running schemes are configured for the plugin, it is necessary to select the newly configured configuration for running
aubo_scope(here the author's configuration is renamed asdebug_myplugin), as shown in the figure: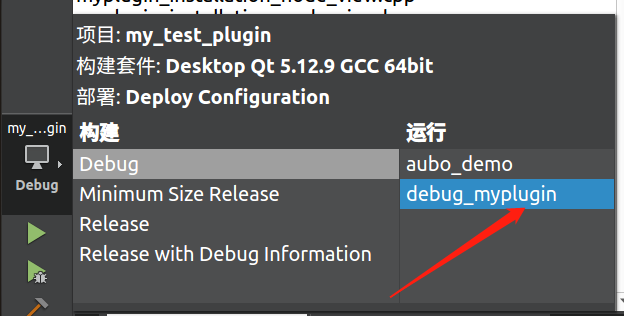
The result of compiling the plugin run is as follows:
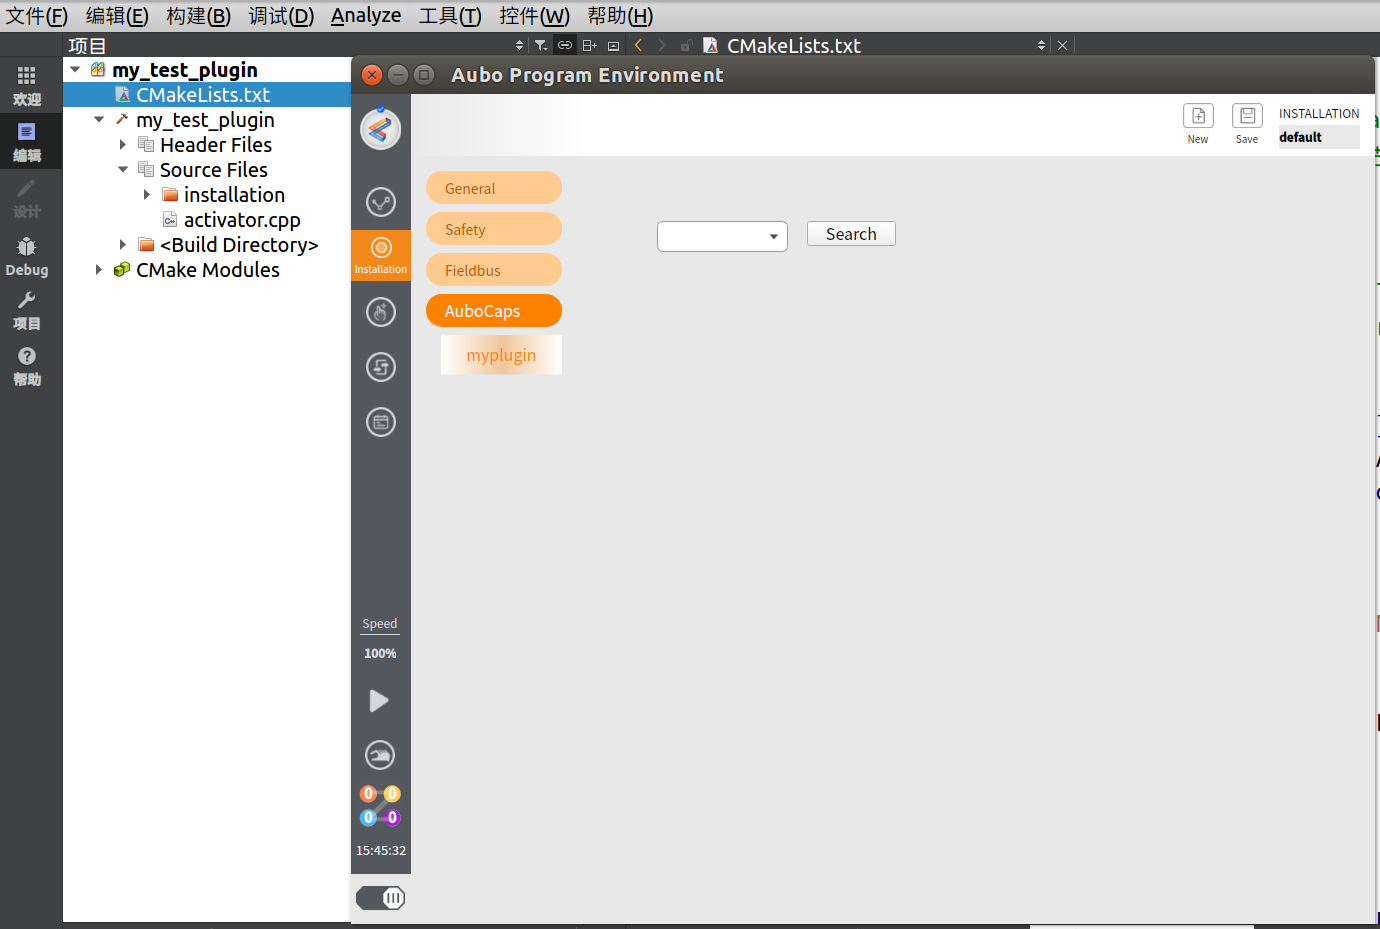
It should be noted that when loading the plugin into the
aubo_scopedemonstrator for the first time, a zip format compressed package of the plugin needs to be providedarcs_ws
Development and debugging scheme of teaching pendant plugin based on gdb
Setting of plugin output path:
The operation of aubo_capsmust be loaded into the working directory of aubo_scope. After installing the arcs package, a folder named arcs_ws will be generated in the root (or home) directory, which is the working range ofaubo_scope.Therefore, when building a runnable plugin, set the output path of the target property to arcs_ws.
The implementation is as follows: (set in CMakeLists.txtof the plugin project, take the example plugin project mypluginas an example)
#Setting the output path of the plug-in
set(PLUGIN_OUTPUT_PATH $ENV{HOME}/arcs_ws/extension)

#Building plugins that can be loaded in aubo_scope
add_libary(myplugin SHARED
	${_srcs}
	${install_src}
	${program_src}
	)
set_target_properties(myplugin PROPERTIES
	LABELS aubo_caps
	OUTPUT_NAME myplugin
	PREFIX ""
	DEBUG_POSTFIX ""
	LIBRARY_OUTPUT_DIRECTORY ${PLUGIN_OUTPUT_PATH}/myplugin
	CXX_VISIBILITY_PRESET hidden
)
In this example, the
${_srcs},${install_src},${program_src}files used in generating themyplugindynamic library file can be set according to the needs of your own plugin.When setting the generated
mypluginattributes, in this tutorial you only need to focus on setting theLIBRARY_OUTPUT_DIRECTORYtarget path, and other attributes can be set according to your own plugin needs.The purpose of this is to automatically update the plugin's dynamic library files in the
arcs_wsworking directory after updating the plugin's source code, rather than having to manually add the plugin'szippackage to thearcs_wsdirectory as the first time the plugin was loaded inaubo_scope.
gdbbased plugin debugging process:
Similarly, the first time a plugin is loaded into aubo_scope, the plugin must be packaged in zip format and copied to the arcs_ws directory.
Compile the plugin source code:
Go to the root directory of the plugin project, and then execute the following commands: here the compilation must be careful to keep the
debugmessage, or else startingaubo_scopeand hitting a breakpoint in the plugin won't go into the plugin dynamic library code. That is:cmake -DCMAKE_BUILD_TYPE=Debug ..bashmkdir -p build cd build cmake -DCMAKE_BUILD_TYPE=Debug.. make -j`nproc`Start
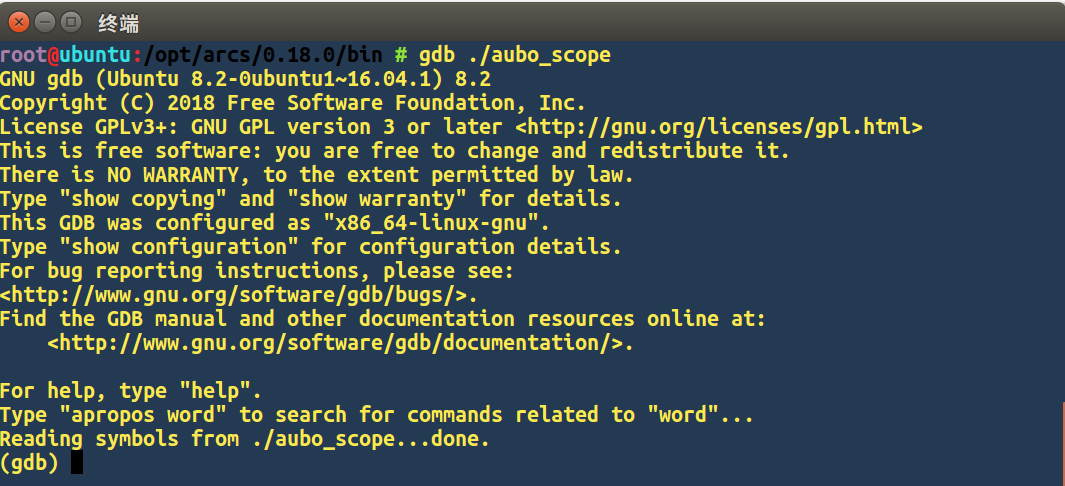
aubo_scopeundergdb:The default installation path of
aubo_scopeis under/opt/arcs, if you have more than one version ofaubo-scope, you need to choose the appropriate version, and then go to thebindirectory to find theaubo_scopeexecutable file. (The author has chosen version 0.18.0.)bashcd /opt/arcs/0.18.0/bin gdb ./aubo_scopeIf the startup is successful it will prompt:
gdbReading symbols from ./aubo_scope...done.Set breakpoints, debugging plug-in source code: (here breakpoints need to be set to the plug-in source code)
Debug directly by setting breakpoints with the break command.
The mypluginplugin is used as an example to show a debugging process and its simplicity:
Compile the
mypluginsource code: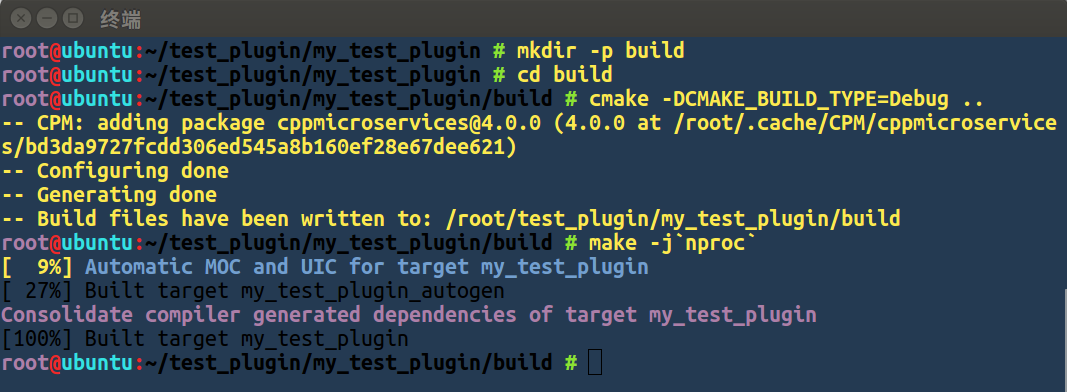
- start
gdb:
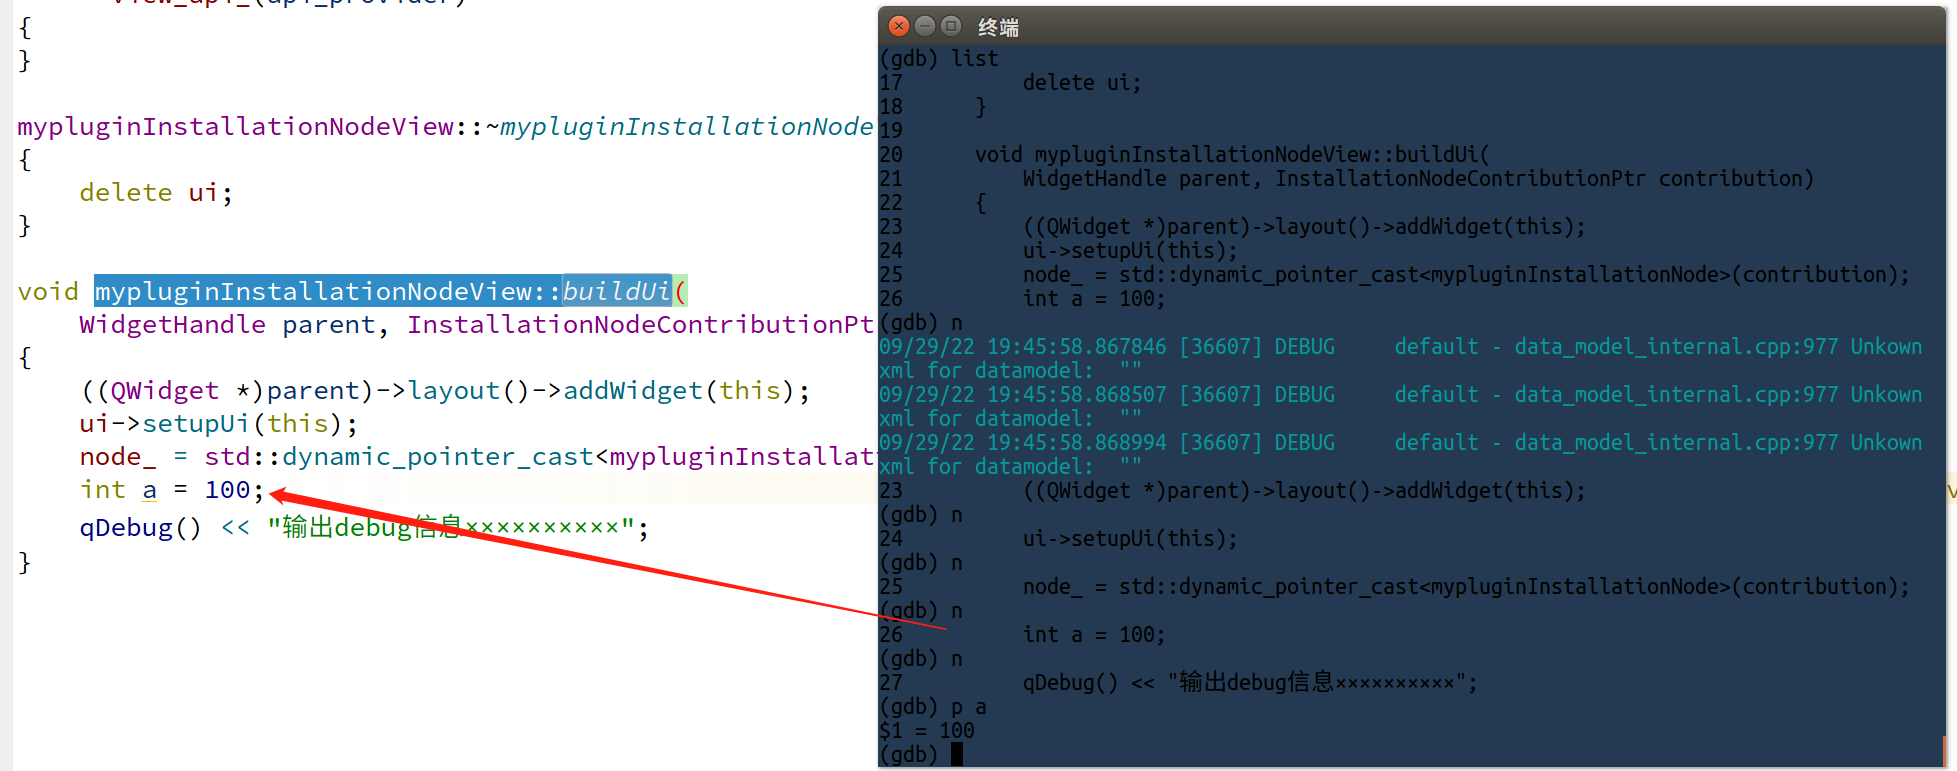
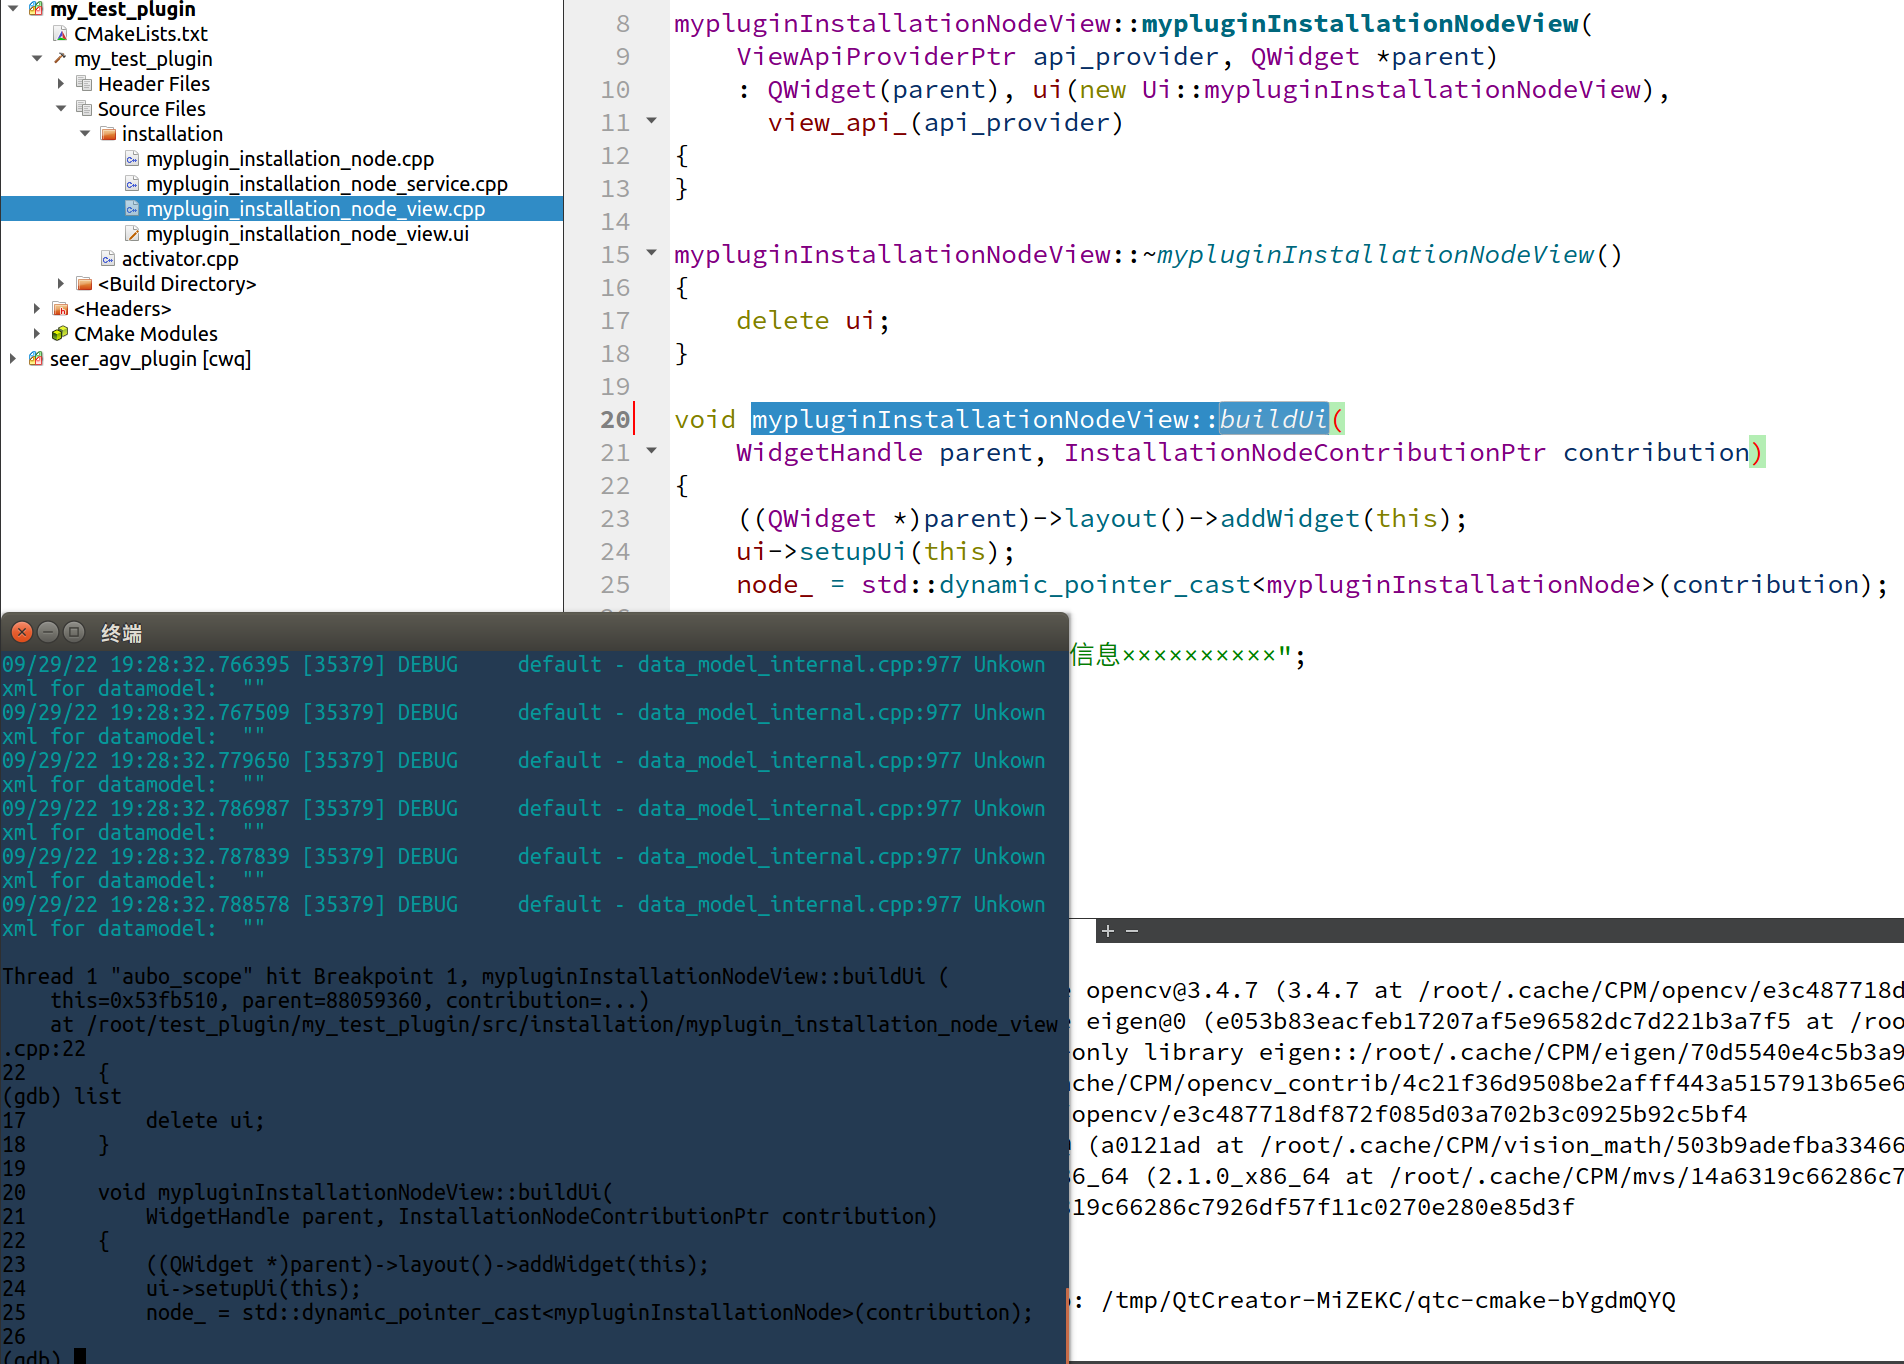
Setting breakpoints: (the location of the breakpoints here is shown below)
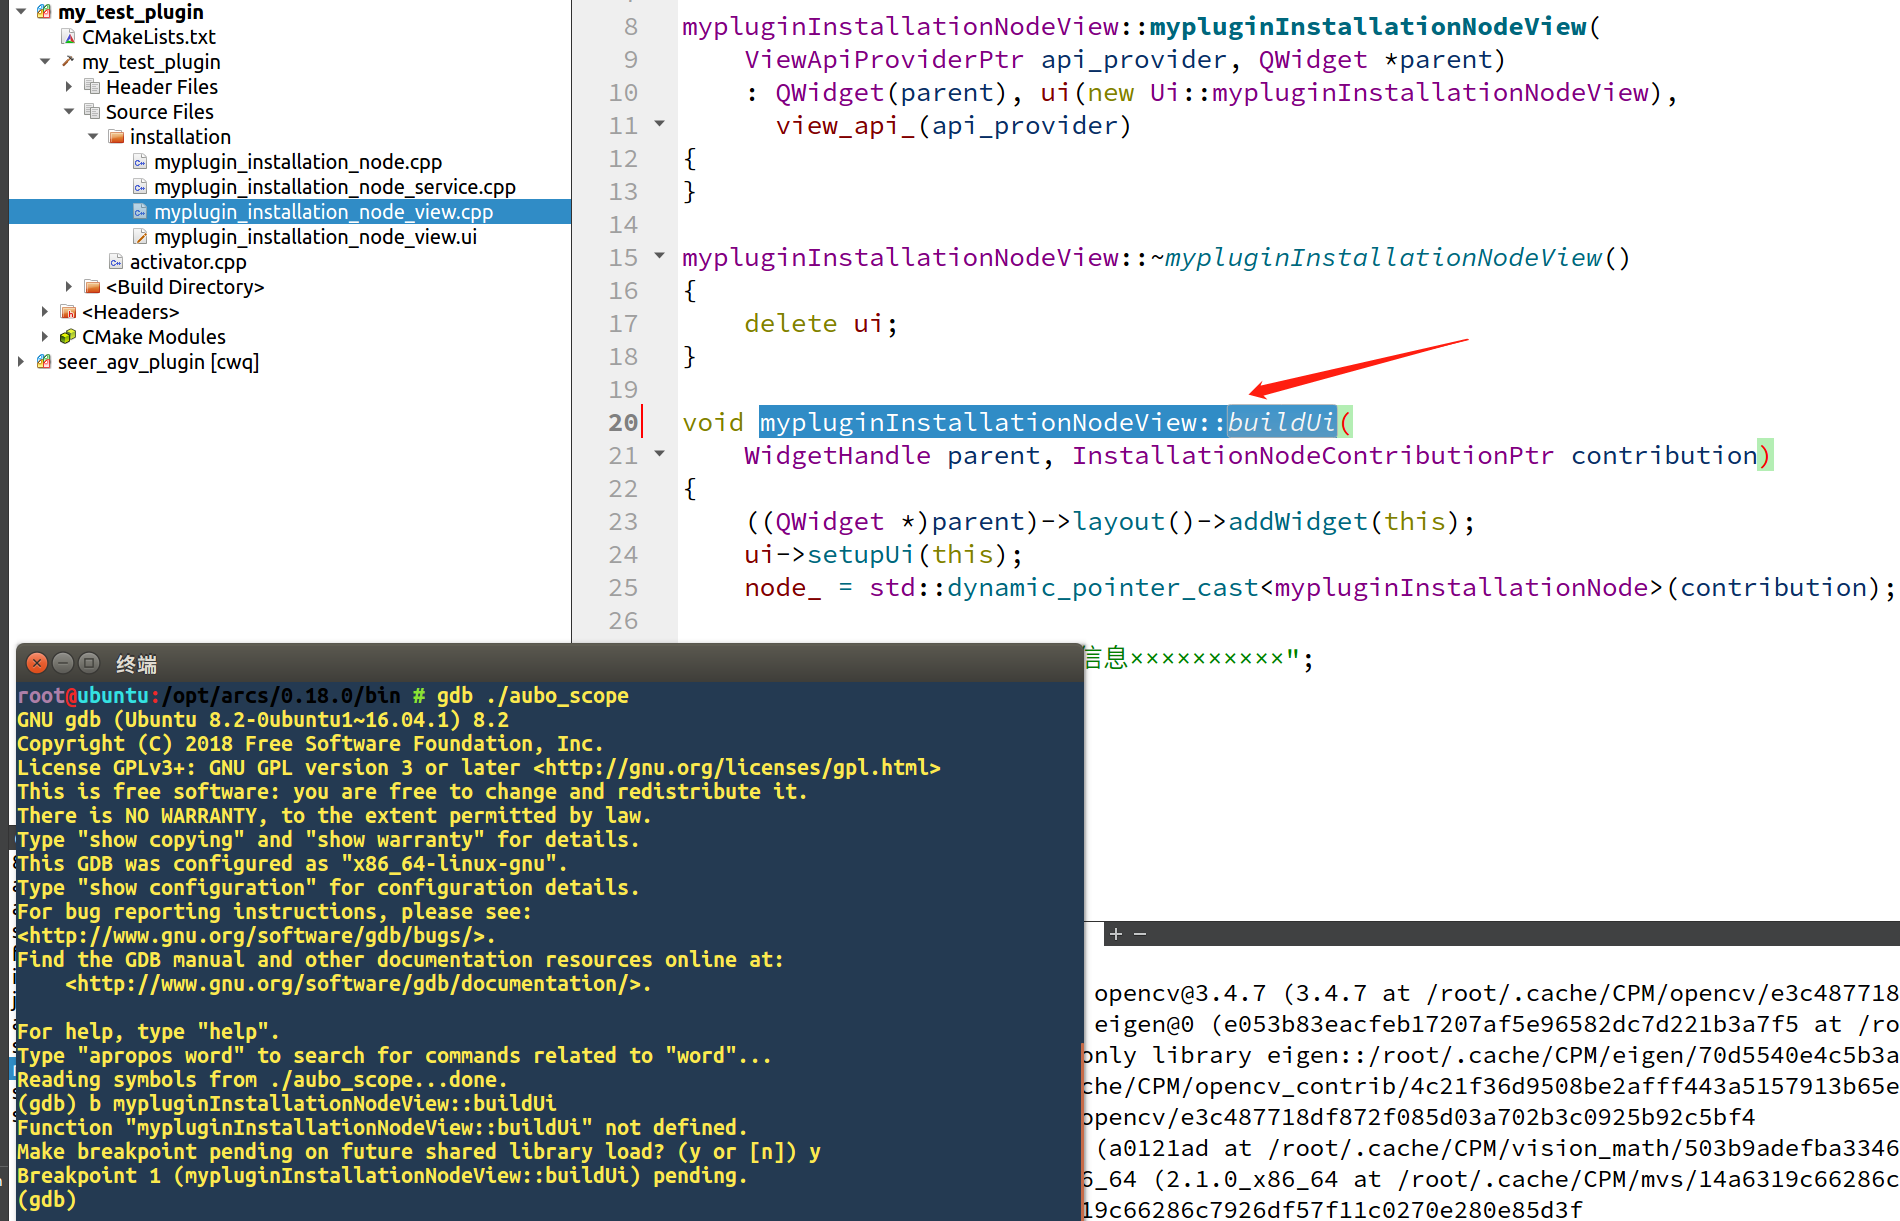
- View source code at breakpoints: (use the
listcommand to view source code information for the current stack area, default display is 10 lines).
- To see the value of a variable: (use the single-step call command
bto let the program run to the positionint a = 100and use thepcommand to see the value ofa).